
The Roll of Probability:
Experimentation With Dice Rolls:max_bytes(150000):strip_icc()/TwoDice-58bddad45f9b58af5c4aa0d4.jpg)
Abstract: Rolling a pair of dice and getting a set of numbers is all based upon probability. A dice has six sides, each with values ranging from one to six. This experiment consists of a pair of dice being rolled and then recording the sum of the two dice per roll. This will be repeated for 100 times and the sum of each roll will be recorded each time. After the data of 100 dice rolls are recorded, it will be used to determine which sum had the highest probability of being rolled. My hypothesis is that the number seven will be the most frequently rolled sum. However, the lab experiment results displayed that the sum of six was most frequently rolled. According to the data acquired from the conducted experiment, the sum of six had a 19% chance of being rolled, which was the highest probability compared to any other sum.
Name: Humayun Kabir
Date: March 19, 2019
Introduction: The dice roll experiment consists of rolling a pair of dice 100 times. The reason for conducting this dice roll experiment is to identify which sum of two dice rolls will have the highest probability of being rolled. Each time the dice are rolled, data is recorded about the sum of the dice. Using the data that was recorded of the dice rolls and their sums after 100 rolls, we began to calculate the statistics of these sums. My hypothesis is that seven might be the highest occurring sum from the two dice being rolled.
Materials:
2 Dice
1 Pencil
1 Piece of Paper
Method:
- Start by using a pencil to draw on the paper, a data table with one column labeled “Dice sum”, a second column labeled “Times Rolled (Number)”, and a third column labeled “Times rolled (Tally Marks)”.
- Label under the Dice sum with values from two through 12.
- Roll the two dice and add up their values and get their added-up sum.
- Tally down the number of times that sum was rolled in column three, and the number of tallies in column two.
- Repeat steps three to four for 100 dice rolls.
- After 100 dice rolls, identify based on the calculations which sum occurred the most from the dice rolls.
Results: After the experiment had been conducted, our results revealed that six is the most frequently rolled sum from the pair of dice. The median numbers had a trend of being more frequently rolled. Shown below, Figure 1 is a bar graph representing the data results and Figure 2 is a pie chart also displaying the data from the results of the experiment but in terms of percentages as well.
Figure 1: Bar Graph representing the 100 rolls and their rolled number.
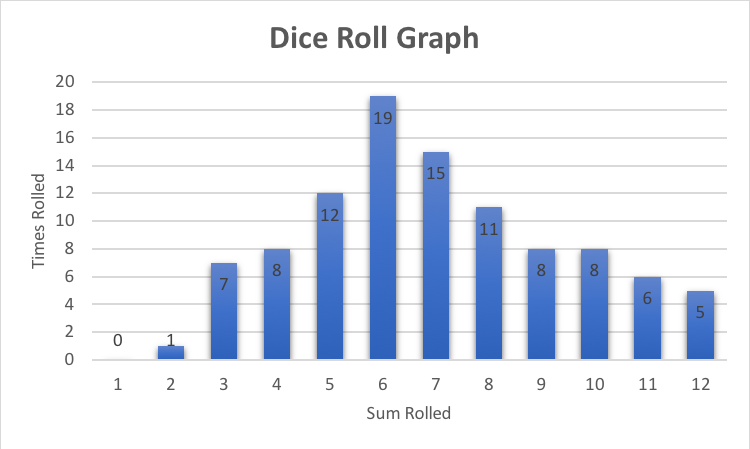
Figure 2: Pie Chart representing the 100 rolls and their rolled number and in percentage value.
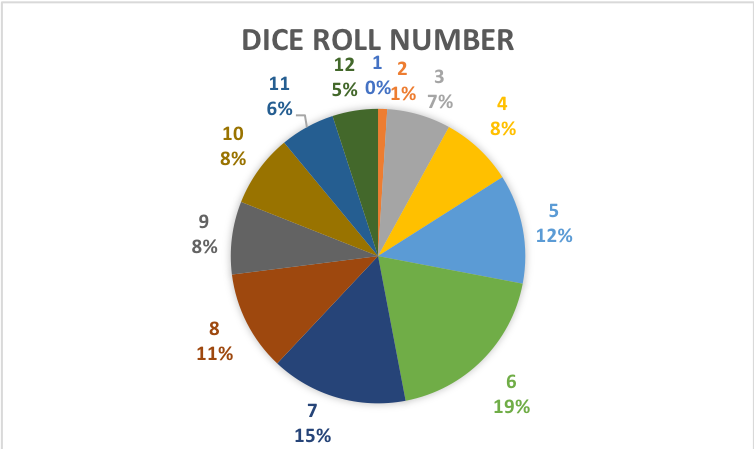
Analysis: After the dice roll experiment was conducted, results showed that the most occurring sum from a pair of dice being rolled 100 times was six. Each time the dice were rolled the sum of the roll was recorded, which Figure 1 and Figure 2 both show this data from the rolls. Figure 1 is a bar graph representing the dice roll sums frequency from the sums two through 12. Displayed in Figure 1, the number six is the sum that was rolled the most. Similarly, Figure 2 is a pie chart displaying the results from the experiment. As can be seen in Figure 2, the pie chart displays the number six being the most frequent sum that was rolled. A trend sequence shows that the median value numbers have higher frequencies of being rolled.
Referring back to the hypothesis, I can deduce that my hypothesis was incorrect because I stated the number seven would be the highest rolled sum. The reason for my hypothesis choosing seven as the number most frequently rolled sum is because, in most games that involve dice rolls, the number seven is considered the “lucky number” number. Also, with my previous experiences with dice rolls, seven would be the most frequent sum rolled from a pair of dice.
Furthermore, another similar experiment was conducted involving dice rolls called “Investigation of Probability Using Dice Rolling Simulation” In this experiment, a dice roll simulation was conducted with three dice, and similarly, they were trying to identify which number would be frequently rolled the most. In this experiment, they used a simulation that automatically recorded the data of the value from the role of three dice. This experiment also had higher frequencies of their median values being rolled similarly like my dice roll experiment.
Conclusion: The purpose of conducting the dice roll experiment was to identify the most frequently occurring number from a pair of dice. The hypothesis was that the number seven would be the most frequently rolled number, however, results showed otherwise. After the experiment was conducted, results displayed that the number six is the most frequently rolled number according to recorded data. Additionally, a trend identified that median value numbers had a higher frequency than low or high rolled numbers. The data of this experiment is reliable because of the high amount of trials; reducing any chances of errors.
Resources:
Lukac, S., & Engel, R. (2010). Investigation of probability distributions using dice rolling
simulation. Australian Mathematics Teacher, 66(2), 30–35. Retrieved from
http://ccny-proxy1.libr.ccny.cuny.edu/login?url=https://search.ebscohost.com/login.aspx?
direct=true&db=a(h&AN=51533174&site=ehost-live
Appendix:
| Dice Sum: | Times Rolled (Number): | Times Rolled (Tally Marks): |
| 2 | 1 | I |
| 3 | 7 | IIIIIII |
| 4 | 8 | IIIIIIII |
| 5 | 12 | IIIIIIIIIIII |
| 6 | 19 | IIIIIIIIIIIIIIIIIII |
| 7 | 15 | IIIIIIIIIIIIIII |
| 8 | 11 | IIIIIIIIIII |
| 9 | 8 | IIIIIIII |
| 10 | 8 | IIIIIIII |
| 11 | 6 | IIIIII |
| 12 | 5 | IIIII |

This entry is licensed under a Creative Commons Attribution-NonCommercial-ShareAlike 4.0 International license.